Screens from the live demo portal: real plants with the names hidden, 21 November 2026, early afternoon.
1 · Signing in
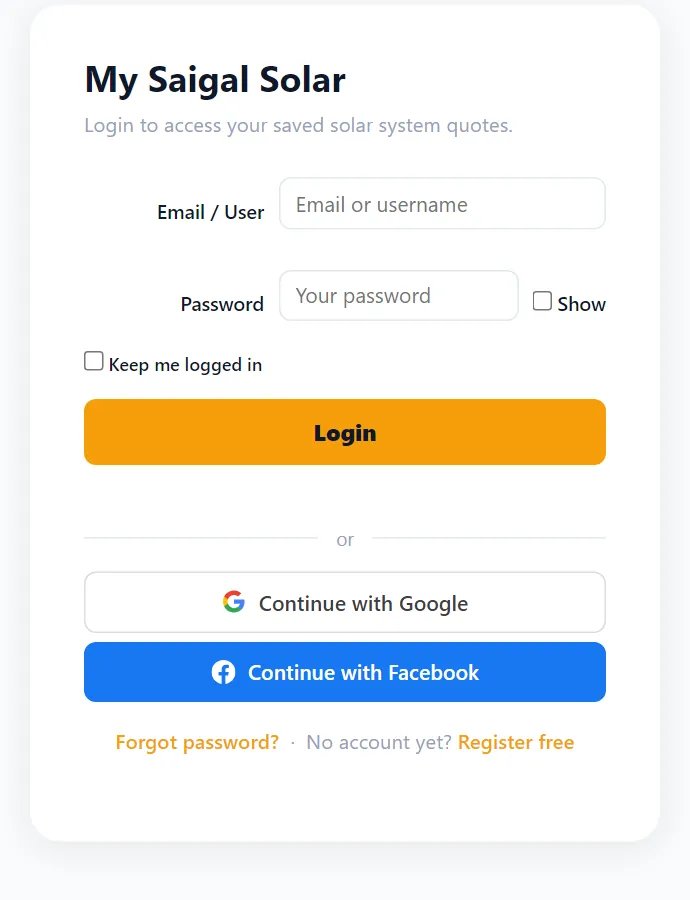
1Open the address we sent you, for example portals.saigal.us/your-company. You will see the login screen.
2Type your email (or username) and your password. Or tap Continue with Google if we added your Gmail address.
3First time? Tap Forgot password? to set your own password. Tick Keep me logged in.
4Bookmark the page, or on a phone use Add to Home screen. Next time it opens straight to your plants.
3 · The Overview
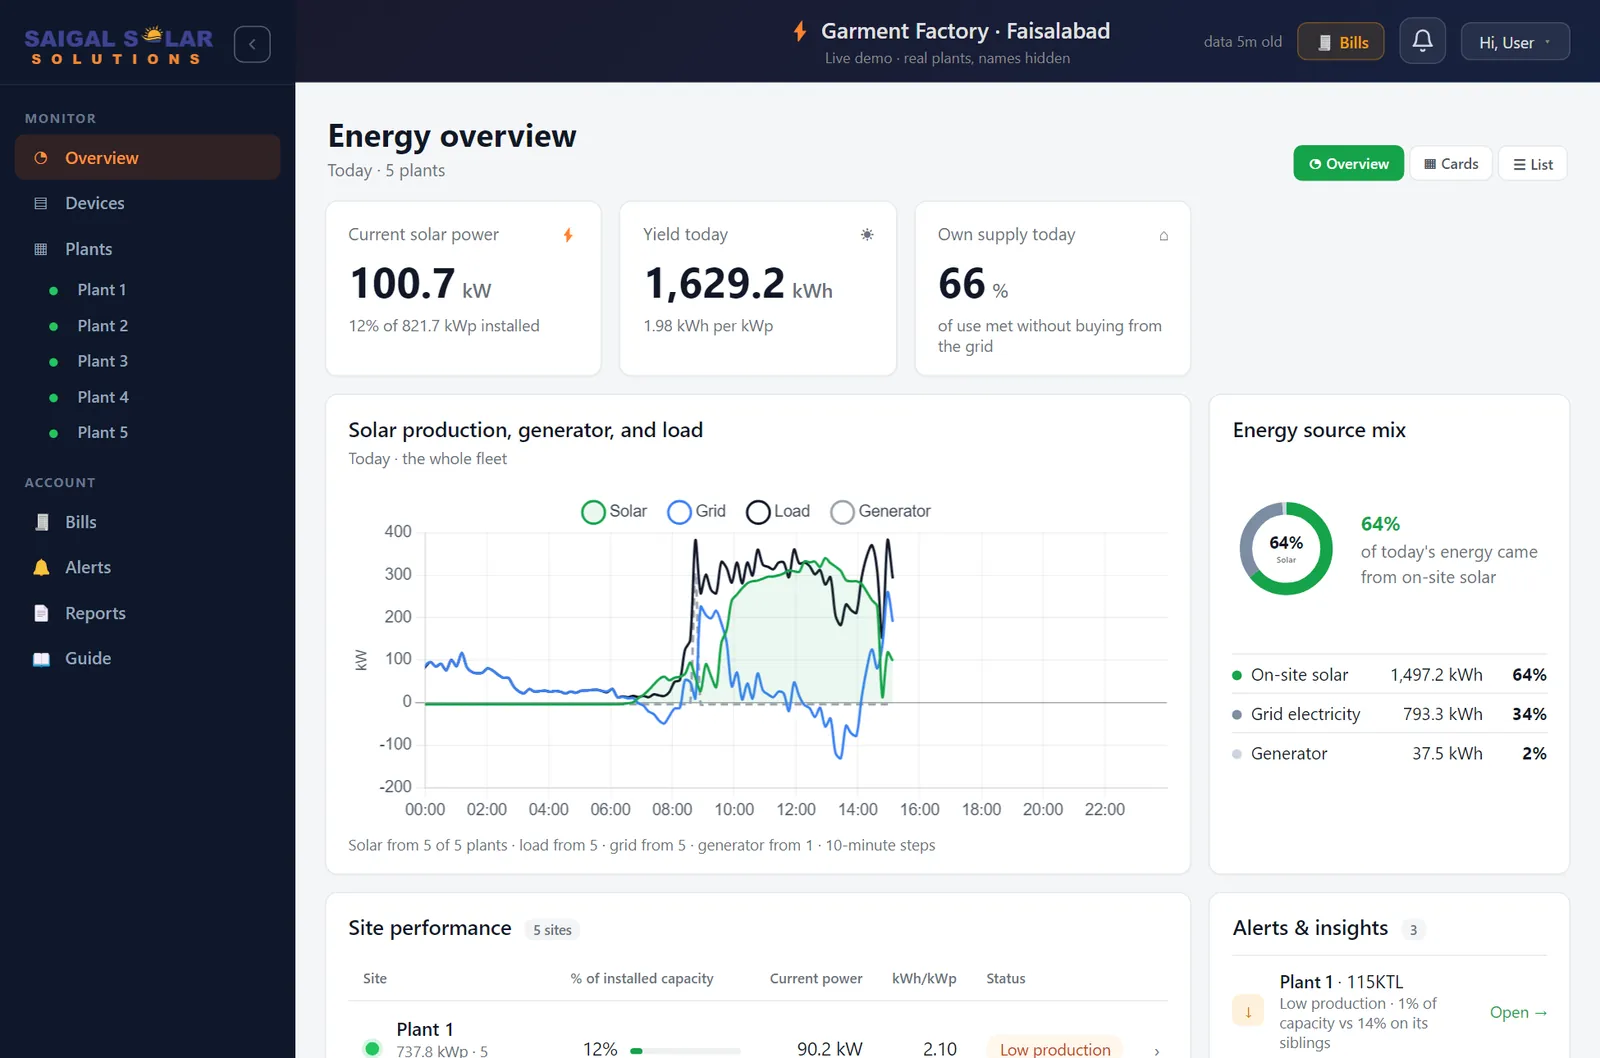
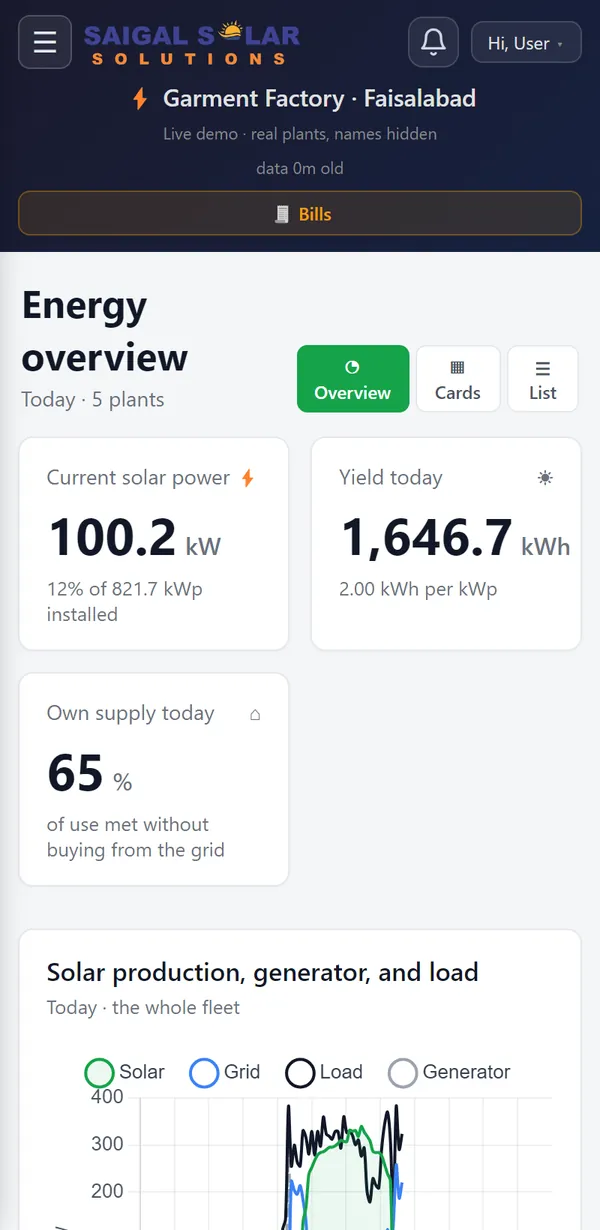
- Current solar power: what all your plants are making right now, and how much of the installed size (kWp) that is.
- Yield today: solar units (kWh) made today, and kWh per kWp, which is how hard the plants worked. Around 2 to 2.5 is a normal clear November day; 4 to 5 is a good summer day.
- Own supply today: how much of your use was met without buying from the grid.
- The chart: today's solar, grid, load and generator. The grid line above zero is power you buy; below zero is power you send to the grid.
- Energy source mix: where today's energy came from: solar, grid or generator.
- Site performance: one row per plant with its power now, kWh per kWp and a signal: On track, Low production or Needs attention. Tap a row to see its inverters.
- Alerts & insights: anything that needs a look, for example a panel string giving no current.
4 · Plants: Cards and List
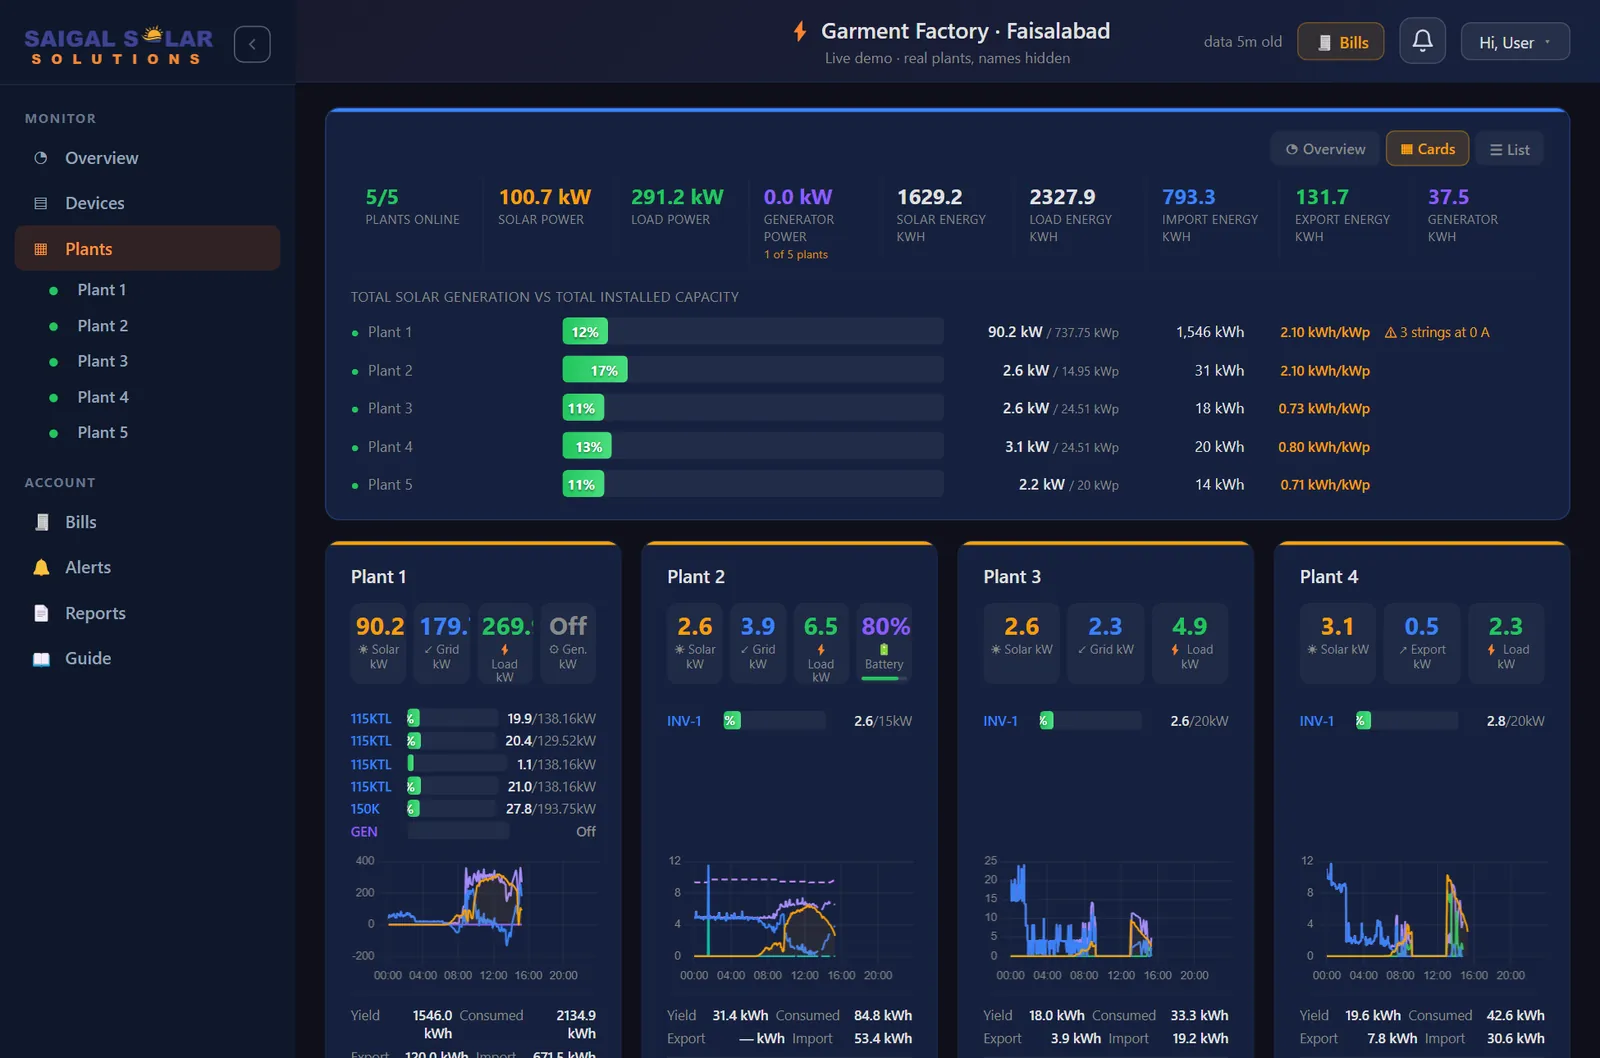
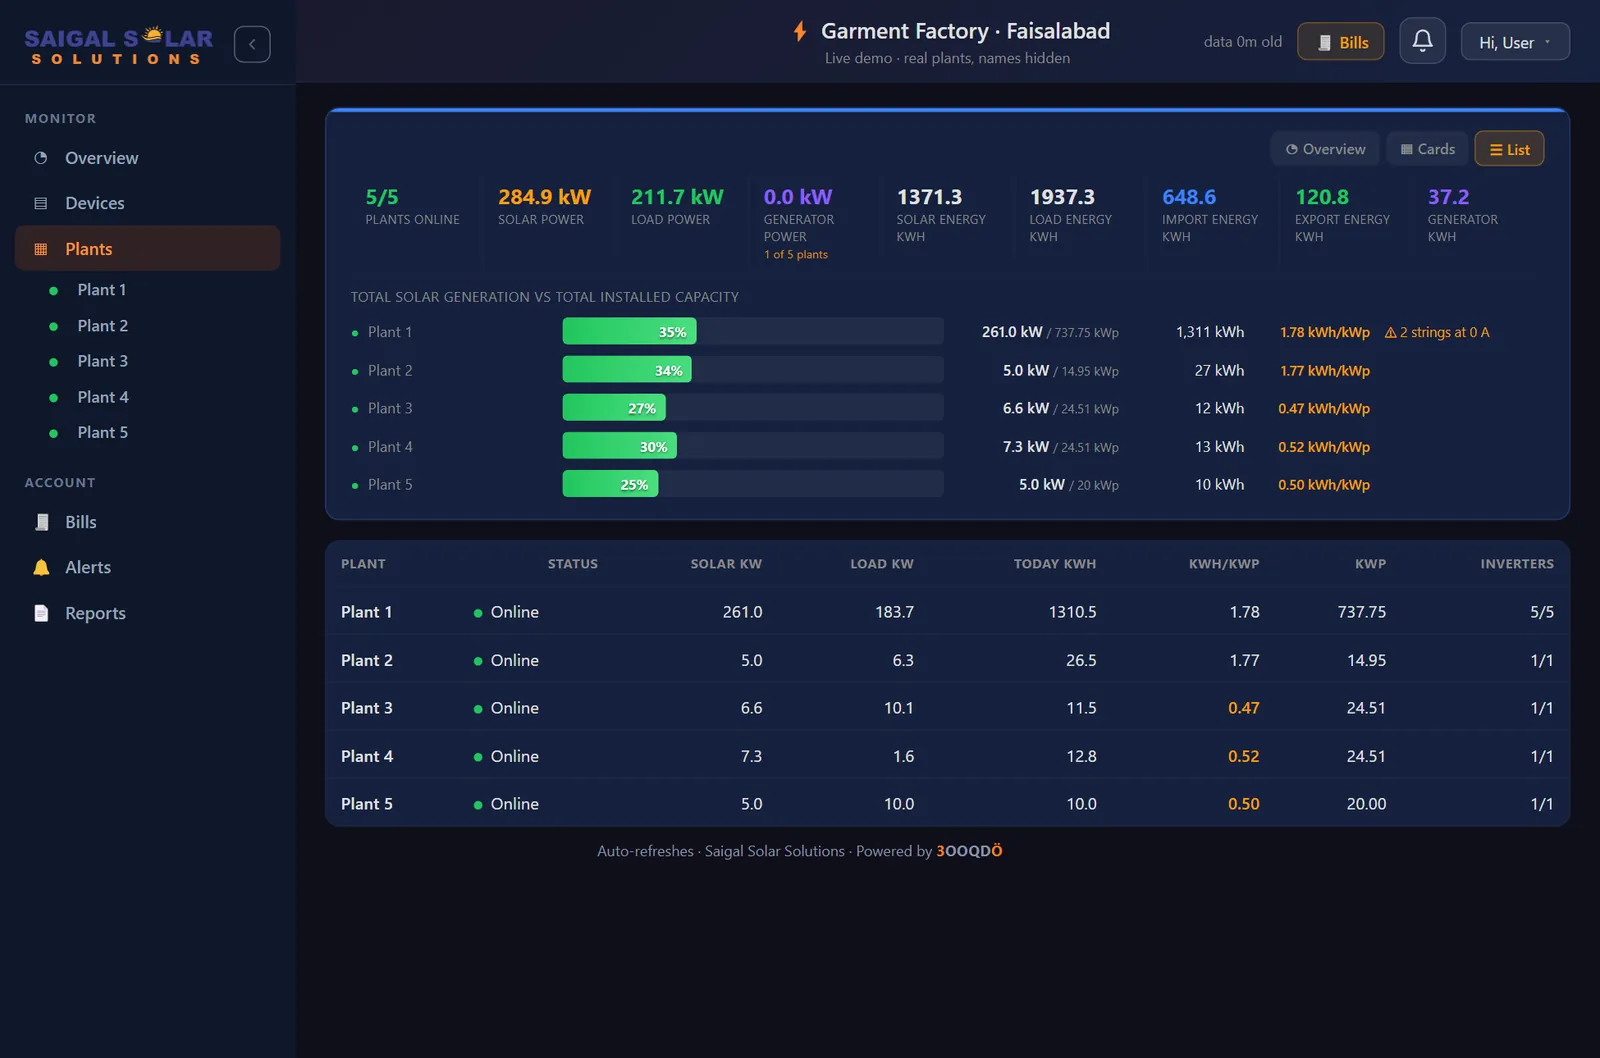
The strip at the top adds up all your plants: how many are online, solar, load, grid and generator power now, and today's units. Under it, one bar per plant shows its power now against its installed size.
Each card shows the plant's solar power now, the grid, the load and the battery (where there is one), a bar per inverter, today's curve, today's units, and the weakest strings. Tap a card to open that plant.
List shows the same plants as a table. Tap a column heading to sort, for example by kWh per kWp to find the plant that worked least today.
5 · Devices
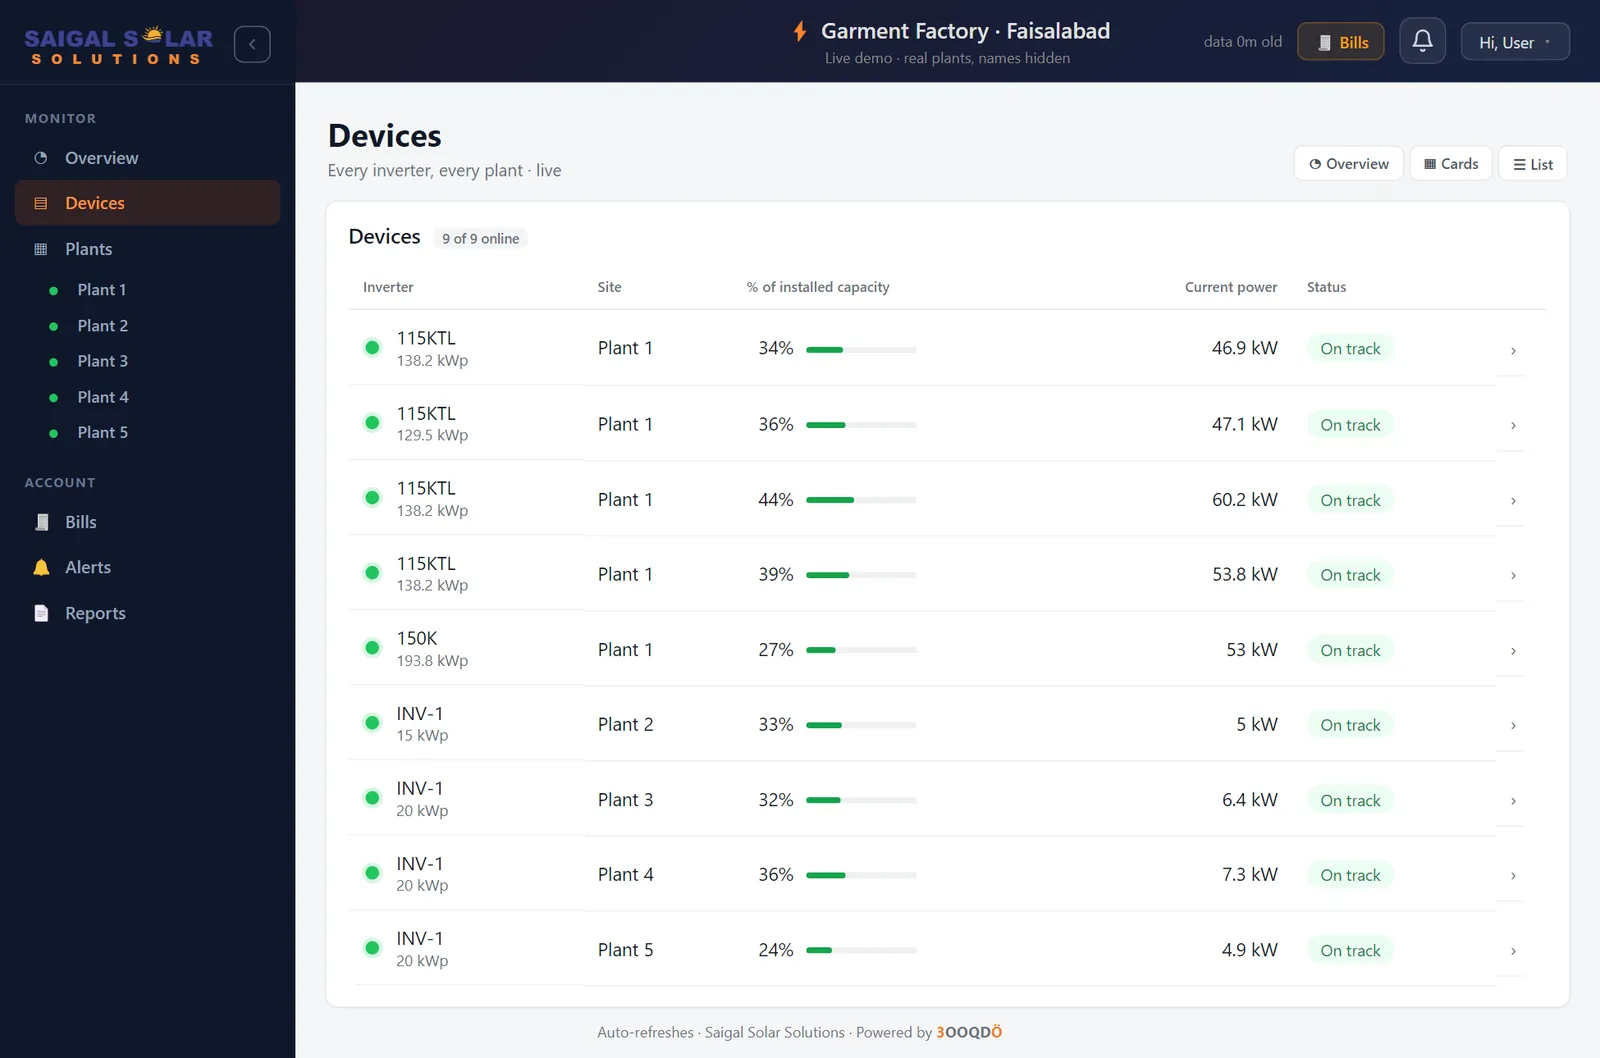
Every inverter you own, in one list: its size, how much of its capacity it is giving now, its power, and the same signal: On track, Low production or Needs attention. An inverter giving much less than its neighbours shows Low production. Tap a row to open its plant.
6 · One plant
The top
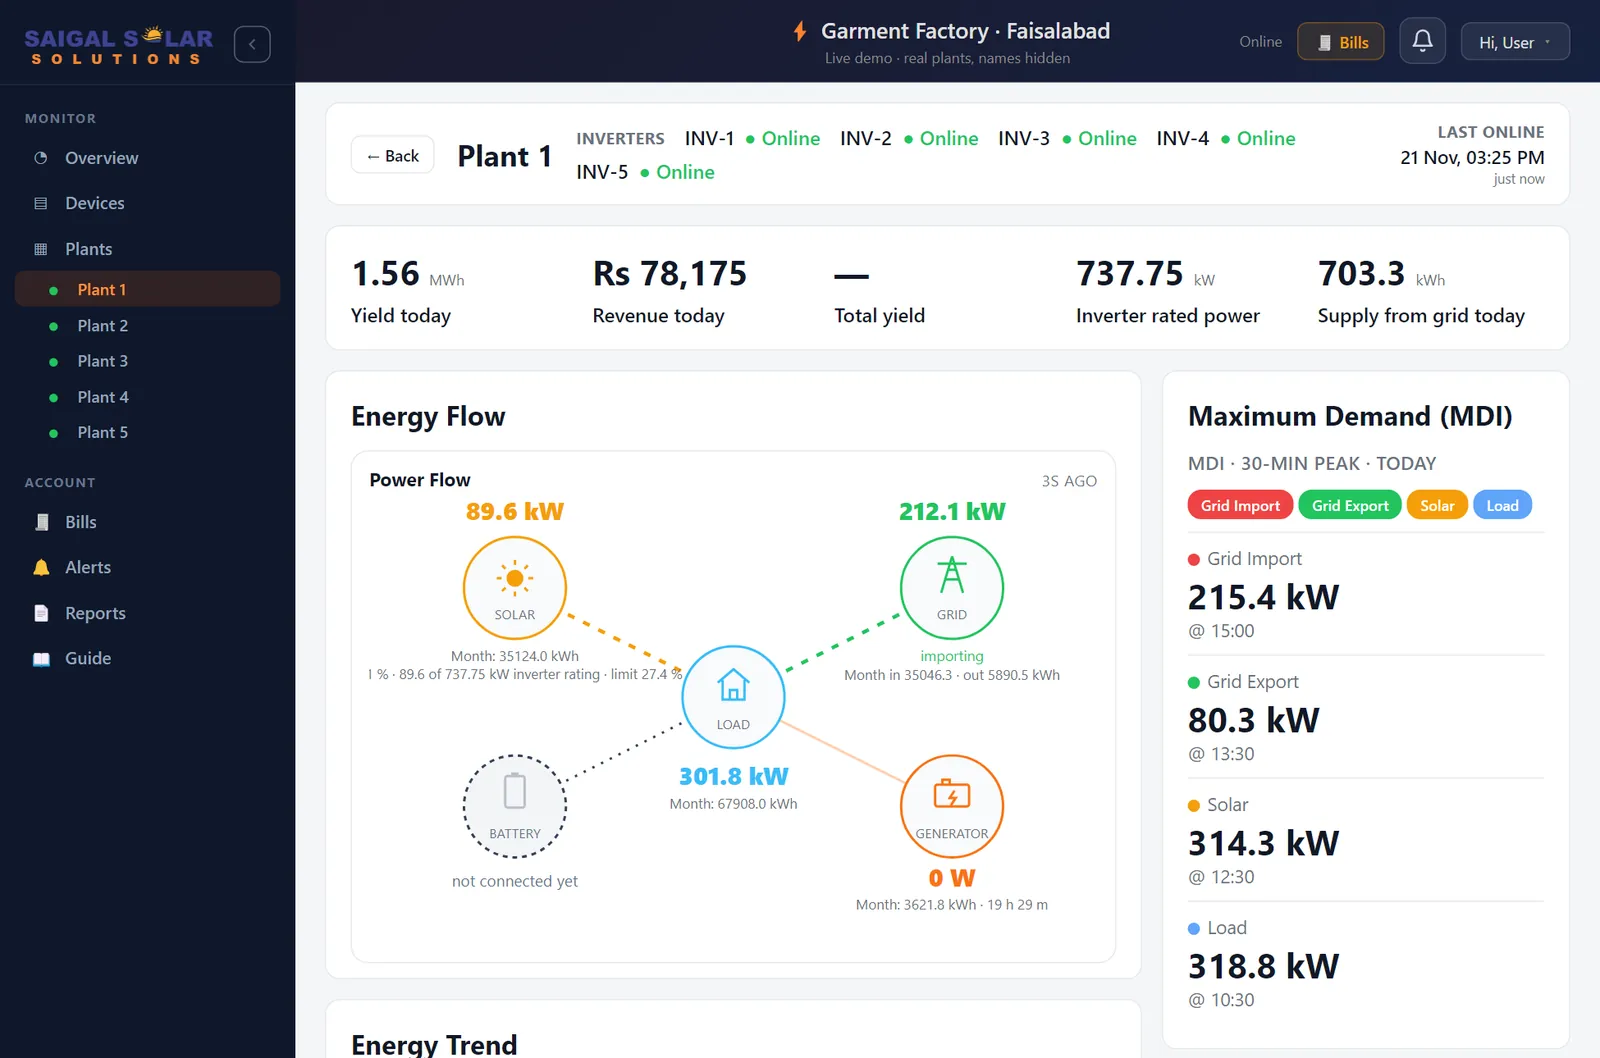
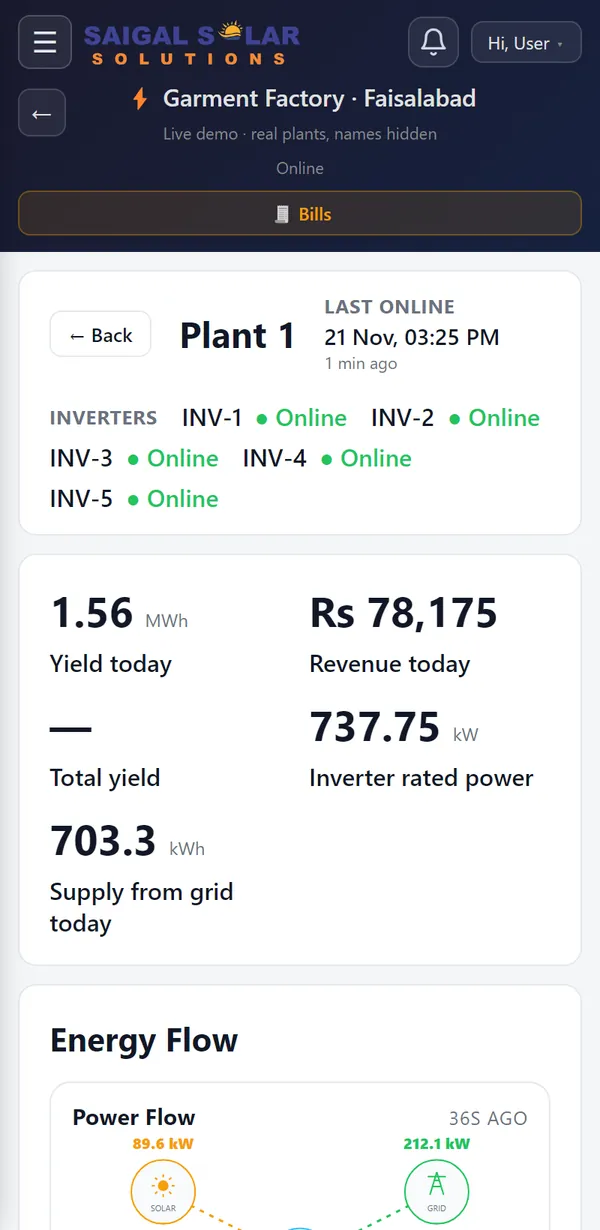
← Back returns to all plants. Next to the name: each inverter's status, then Last online, when the newest reading arrived.
The five numbers
- Yield today: solar units made today.
- Revenue today: today's solar units multiplied by your own tariff (rupees per unit).
- Total yield: everything the plant has made since it was installed (a dash if the inverter does not report it).
- Inverter rated power: the size of the inverters.
- Supply from grid today: units you bought from the grid today.
Energy Flow
A live picture of where power is going: from solar, grid, battery and generator to your load. The grid says importing or exporting. A grey dotted circle means that part is not connected.
Maximum Demand (MDI)
Today's highest 30-minute average for grid import, export, solar and load, with the time it happened. On an industrial connection, the demand (MDI) charge on your bill is based on this kind of peak.
Energy Trend and Revenue Trend
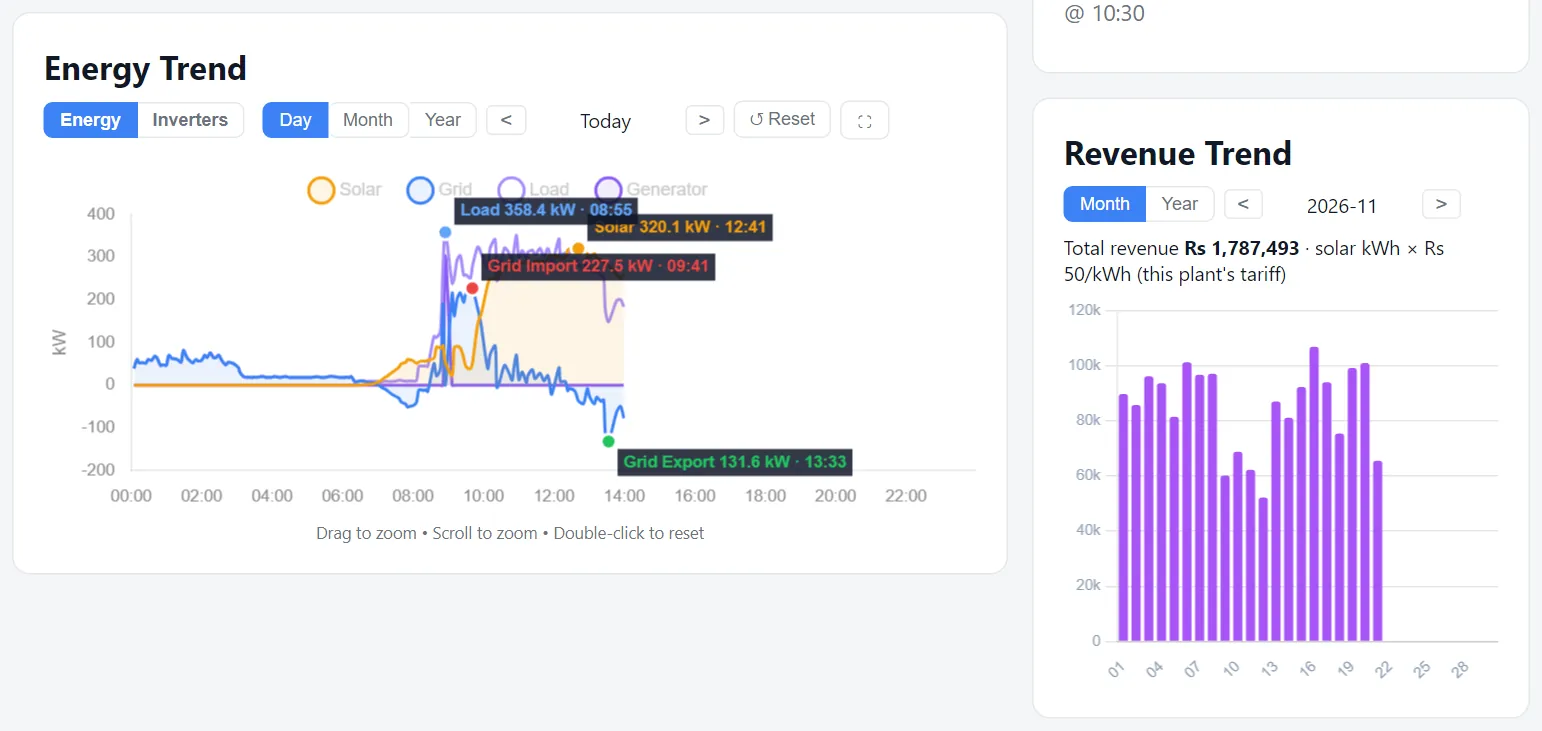
- Day / Month / Year: today's curve, a bar per day, or a bar per month. < > step back and forward.
- Energy / Inverters: the whole plant, or one line per inverter, so a lagging one stands out.
- Drag across the chart to zoom in. Double-click (or Reset) to zoom out.
- Revenue Trend: the money value of your solar, per day of the month or per month of the year, at your tariff.
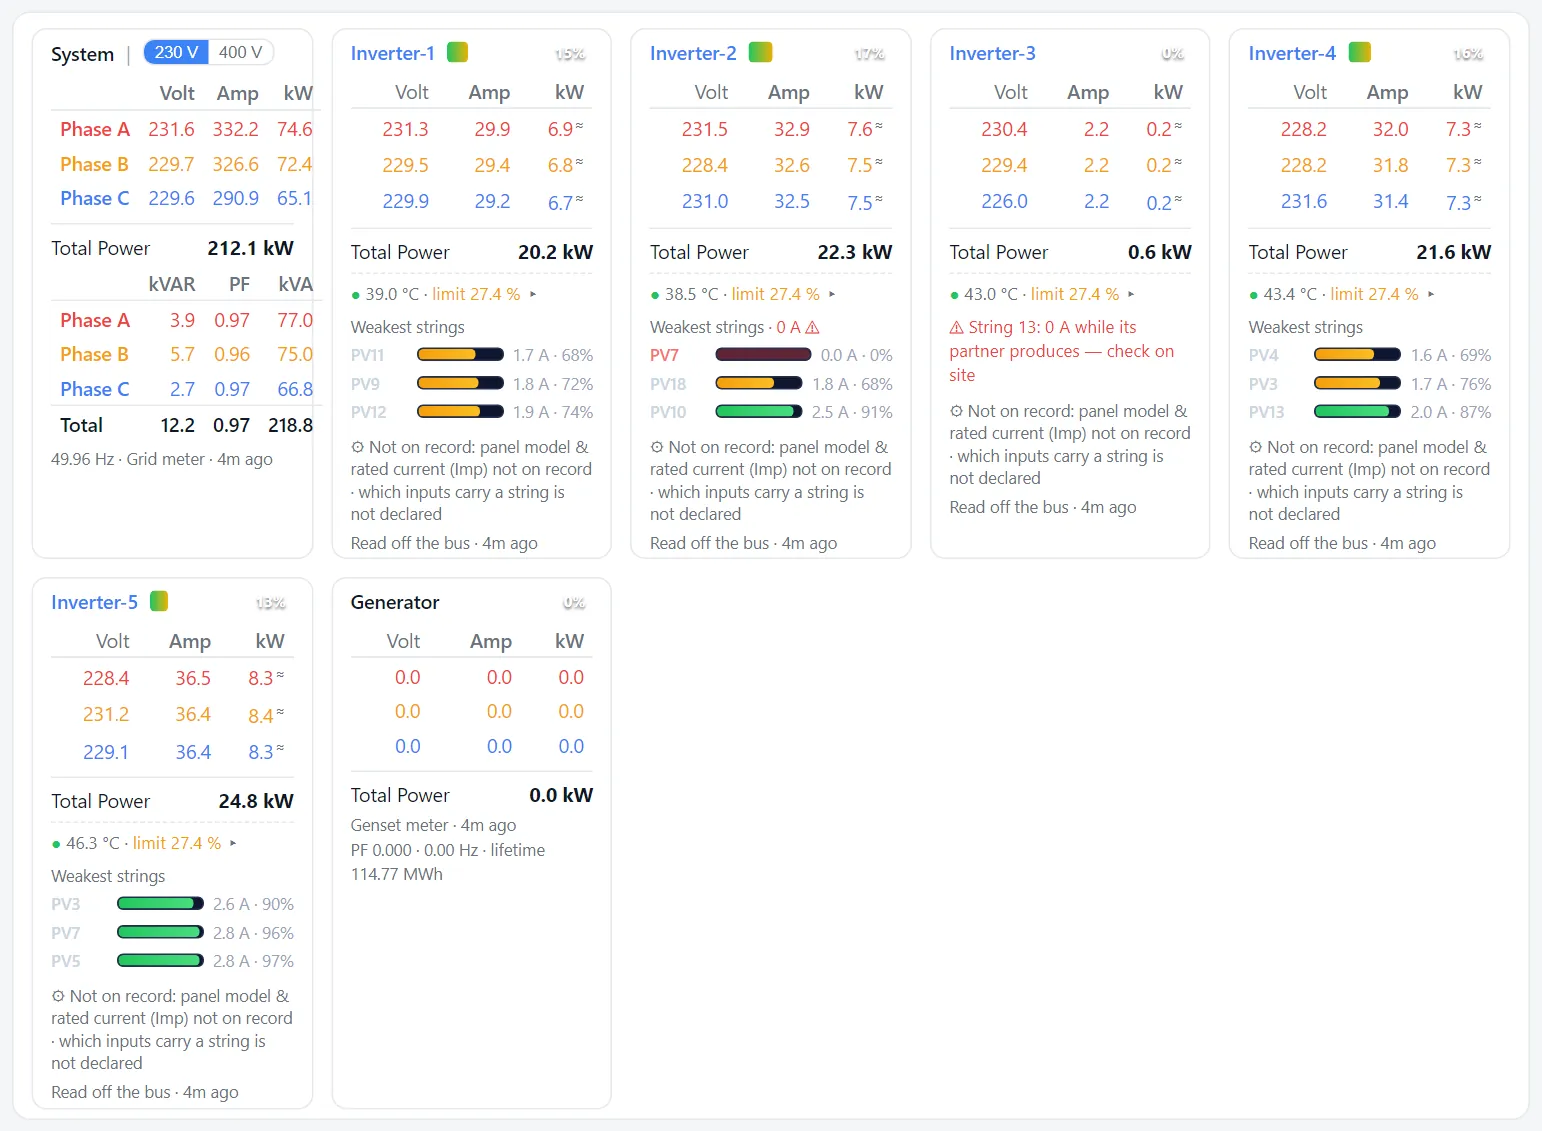
The tiles at the bottom
- System (where there is a grid meter): volts, amps and kW on each phase, then kVAR, power factor (PF) and kVA. A red note warns when the power factor is low, because that can bring a penalty on the bill.
- Each inverter: volts, amps and kW per phase, total power and temperature.
- limit 100 %: the inverter may give its full power. A lower number means it is being held back, for example by export control.
- Weakest strings: the panel strings giving the least current. 0 A while its neighbours produce usually means a loose connector, a blown fuse or shade. Worth a look on the roof.
- Read off the bus 5m ago: when our box on site last read this inverter directly.
- Tap an inverter's name (Inverter-1, Inverter-2 …) to open its own page with every panel string. See the next section.
7 · PV string monitoring: finding the worst strings
A string is one row of solar panels wired together into one input of the inverter. A big inverter has 10 to 20 of them. Strings on the same inverter see the same sun, so they should give about the same current. A string far below its neighbours has a problem: dirt, shade, a loose connector, a blown fuse or a damaged panel. The inverter keeps running, so without string monitoring nobody notices, and the plant quietly loses units every day.
Where you see it
- On each plant card: the 3 weakest strings of the whole plant, with their current (A) and a percentage.
- On the plant page: each inverter tile shows its own 3 weakest strings.
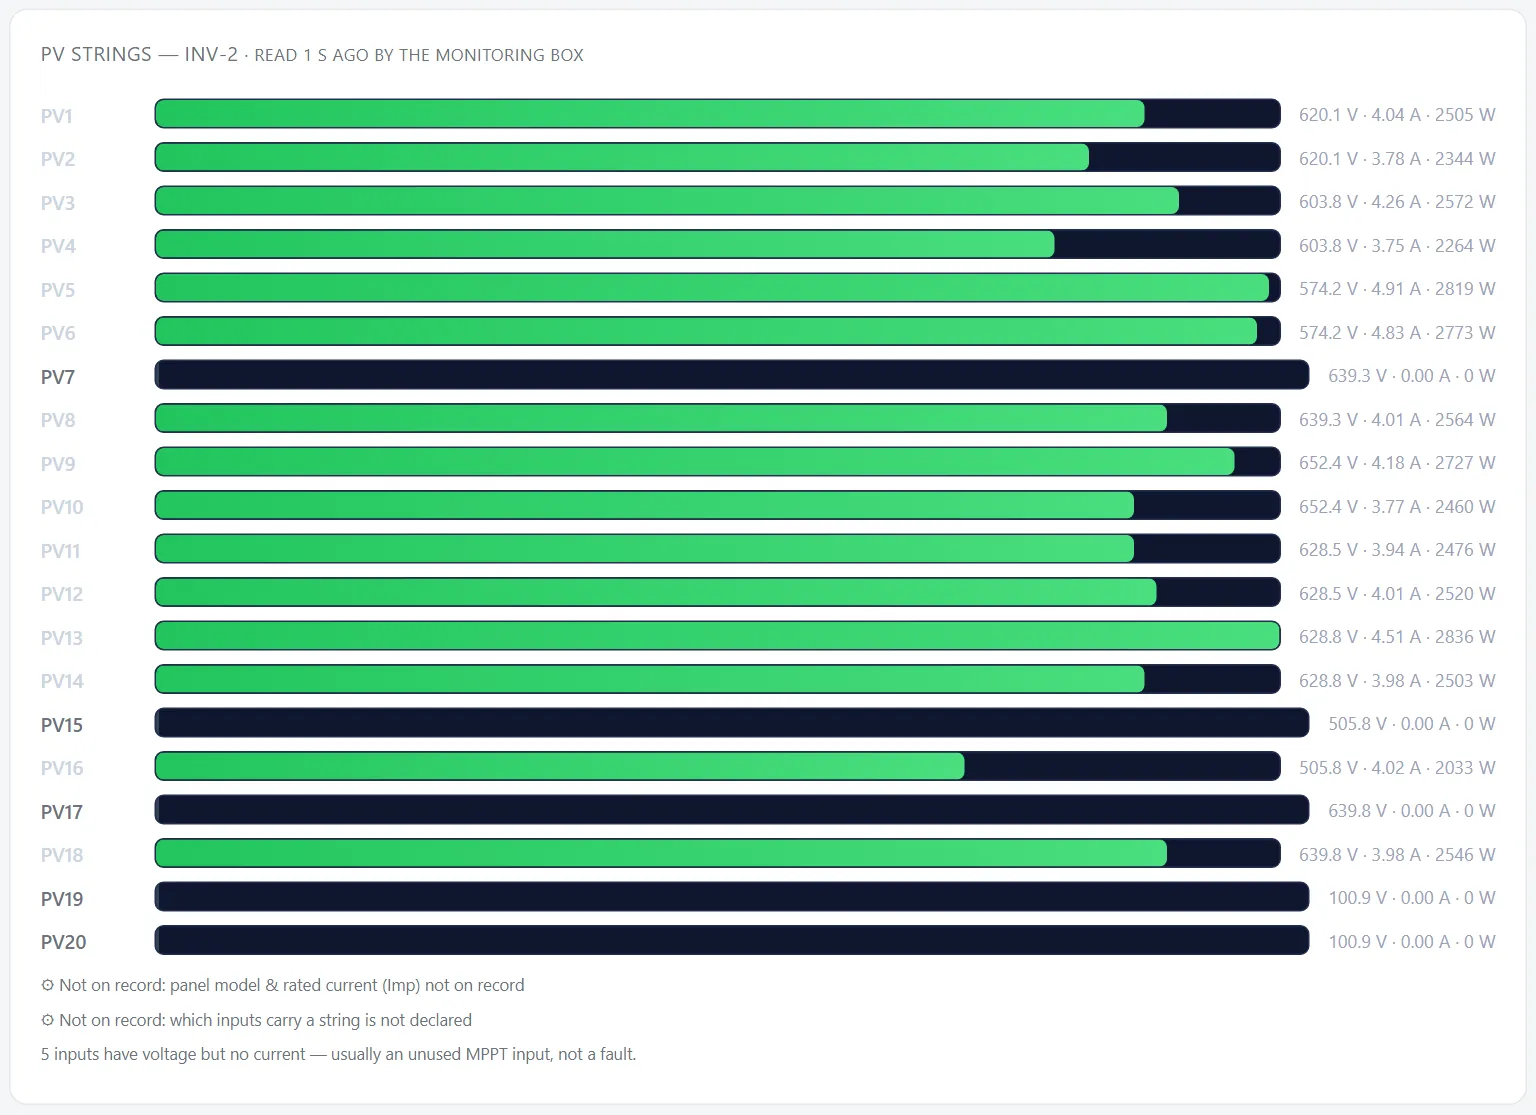
- On the inverter's own page (tap its name): every string with its volts, amps and watts, read every few seconds by our box on site.
- In Alerts: a string at 0 A while the inverter is producing, for example Inverter 2 · PV7 at 0 A.
Reading the bars
- The percentage compares the string with the typical string on the same inverter. 100 % means it is doing as well as its neighbours.
- Green: 80 % or more, normal. Amber: under 80 %, keep an eye on it; if it stays low for days, have it cleaned or checked. Red: under 20 % or 0 A, check it on site.
- Voltage but 0 A on an input can be an input with no string connected to it, or a string that has stopped. Tell us which inputs carry strings and the portal can tell the two apart.
- Not on record: panel model & rated current means we have not yet entered your panel model. Once we have it, each string is also measured against what its panels are rated to give.
8 · Alerts
The bell at the top (or Alerts in the left menu) lists what needs attention: a plant offline, an inverter fault, a string at 0 A, low production. A red number shows how many are waiting. We see the same alerts, and we will contact you if a visit is needed.
9 · Bills and Reports
Bills sets your electricity bill beside what your solar made over the same bill dates, month by month, with a short reading of the month in plain words. To switch it on for a connection, send us its reference number: a photo of the bill on WhatsApp is enough. If a site has more than one meter, send every reference number.
Reports keeps the reports we prepare for you. Open one to read or print it.
10 · The words on the screen
| You see | It means |
|---|---|
| ● Online · On track | Data is arriving and the plant is producing as expected. |
| Offline on an inverter at night | Normal. Inverters switch off without sun and wake with it. Only worry if one stays Offline while the others produce in daylight. |
| Low production | Giving much less than its neighbours, or than your other plants today. |
| Needs attention · Alarm | Offline in daylight, no new data, or a fault reported by the inverter. Open the plant and read the inverter tile. |
| kW | Power right now, like the speedometer of a car. |
| kWh (units) | Energy over a period, like the distance driven. Your bill is in kWh. |
| kWp | The installed size of the solar panels. |
| kWh / kWp | Units made for each kWp installed. The fair way to compare plants of different sizes, or one plant across days. |
| MDI | Maximum demand: the highest 30-minute average. |
| PF · kVAR | Power factor and reactive power. A low power factor can bring a penalty on an industrial bill. |
| — (a dash) | Not measured. Never read it as zero. Grid, load and generator figures need a meter at the site. |
| data 1m old | When the last reading arrived. More than 10 minutes in daylight: check the site's internet, or call us. |
11 · If something looks wrong
- A plant shows Offline in daylight: first check the internet at the site (the WiFi or the cable). The plant keeps producing; only the reporting stops.
- One inverter gives much less than the others: open the plant, switch the chart to Inverters, and read that inverter's tile for a string at 0 A or a limit below 100 %.
- Anything else: WhatsApp or call +92 321 200 7997, or email solar@saigal.us. Tell us the plant name and what the screen says. We see the same data and can usually answer from here.
Not on the portal yet?
Tell us your inverter brands or send your site details, and we will put every plant you own on one screen.
Message us on WhatsAppAbout the monitoring portal